India’s 7.8% GDP Growth: Strong Economic Momentum or Statistical Controversy?
Loading...
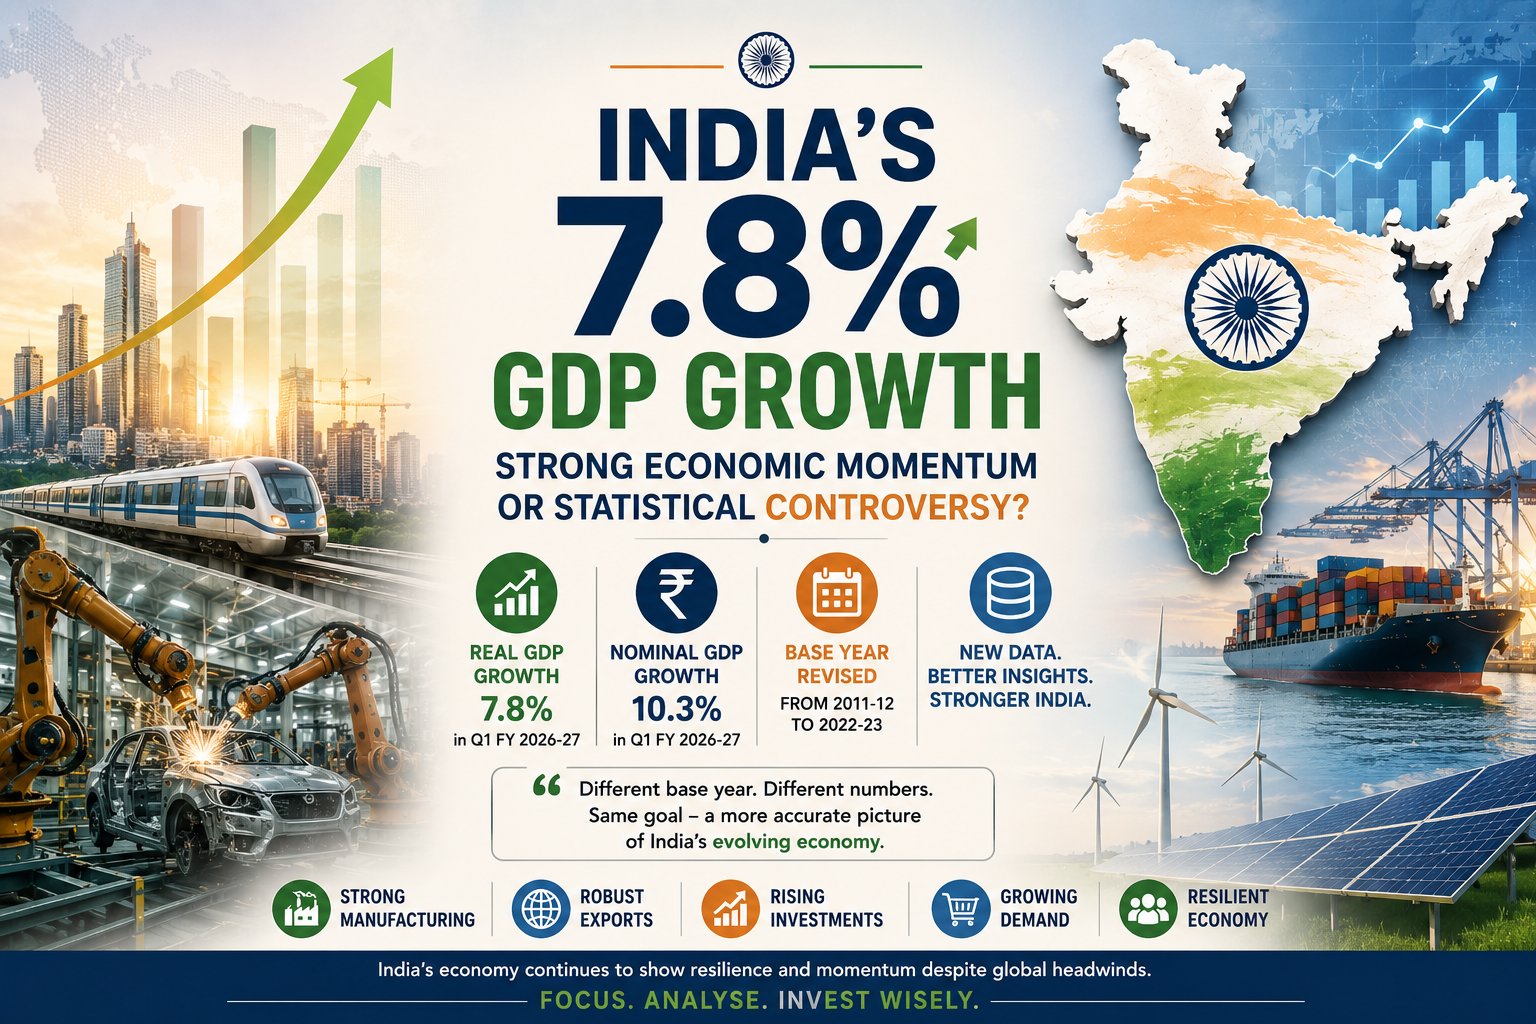
India has reported its Q1 GDP growth numbers for FY 2026-27. Real GDP in Q1 FY 2026-27 is estimated at ₹81.36 lakh crore, compared with ₹75.46 lakh crore in Q1 FY 2025-26, representing a 7.8% year-on-year growth.
Nominal GDP, or GDP at current prices, is estimated at ₹88.27 lakh crore, compared with ₹80.00 lakh crore in Q1 FY 2025-26, representing a 10.3% growth.
While the numbers indicate strong economic growth, they have also triggered a debate over the reliability and interpretation of India's GDP estimates.
What is the controversy about?
The main reason for the debate is the revision of India's GDP series and the change in the base year from 2011-12 to 2022-23.
Under the earlier GDP series, nominal GDP for Q1 FY 2025-26 was estimated at around ₹86.05 lakh crore. Under the new GDP series, the estimate for the same quarter was initially placed at around ₹80.32 lakh crore.
This large difference has led some observers to question whether the reported 7.8% real GDP growth is comparable with the growth rates reported under the previous GDP series.
For example, if one were to compare the current Q1 FY 2026-27 nominal GDP of ₹88.27 lakh crore with the earlier estimate of ₹86.05 lakh crore, the increase would be only around 2.6%.
However, this comparison needs to be treated with caution.
The ₹86.05 lakh crore figure belongs to the old 2011-12 GDP series, while the ₹88.27 lakh crore figure belongs to the new 2022-23 GDP series. The two figures are therefore not directly comparable because they are calculated using different methodologies, data sources and price structures.
For a meaningful year-on-year comparison, Q1 FY 2026-27 should be compared with the revised Q1 FY 2025-26 estimate under the same GDP series.
Therefore, the controversy is not simply about whether the government has "inflated" the GDP number. Rather, it is about how much of the difference in GDP estimates is due to genuine changes in economic activity and how much is attributable to changes in methodology and data sources.
Why was the GDP base year changed?
Changing the GDP base year is a normal statistical exercise carried out by countries periodically.
The purpose is to ensure that GDP calculations reflect the current structure of the economy rather than relying on an outdated economic base.
India's economy has changed significantly since 2011-12.
New industries and economic activities have expanded, including:
At the same time, extensive digitisation has created access to new and more detailed sources of economic data.
For example, administrative databases such as e-Vahan, the Public Financial Management System (PFMS) and GST data can provide more granular information about economic activity.
The use of these newer data sources can potentially improve the coverage, accuracy and detail of India's national accounts.
Why was 2022-23 selected as the new base year?
The government has selected 2022-23 as the new base year because it represents a more recent period that is considered relatively normal after the significant disruptions caused by the COVID-19 pandemic during 2019-2021.
Using a more recent base year allows the GDP series to better capture the present structure of the Indian economy.
What do the economic indicators tell us?
While the change in methodology has generated debate, several high-frequency economic indicators point towards strong economic activity.
Manufacturing remains strong
Several manufacturing categories recorded significant growth during Q1 FY 2026-27.
|
Manufacturing Category |
Q1 FY 2025-26 |
Q1 FY 2026-27 |
|
Electrical Equipment |
9.7% |
27.0% |
|
Other Transport Equipment |
3.8% |
19.5% |
|
Computer, Electronic & Optical Products |
8.8% |
12.4% |
|
Machinery & Equipment |
6.6% |
9.1% |
These numbers suggest that the manufacturing sector continues to experience healthy activity, particularly in areas linked to industrial investment, electronics and transportation equipment.
Automobile activity is improving
Automobile-related indicators also show strong growth:
|
Indicator |
Q1 FY 2025-26 |
Q1 FY 2026-27 |
|
Commercial Vehicle Sales |
-0.3% |
18.3% |
|
Three-Wheeler Sales |
0.1% |
29.7% |
|
Passenger Vehicle Registrations |
11.2% |
13.9% |
|
Goods & Transport Vehicle Registrations |
6.1% |
20.1% |
The improvement in commercial and goods-vehicle activity can be viewed as an indicator of stronger transportation and economic activity.
Exports have also performed strongly
Exports have recorded significant growth during the quarter.
|
Indicator |
Q1 FY 2025-26 |
Q1 FY 2026-27 |
|
Exports of Goods & Services |
5.7% |
25.8% |
|
Imports of Goods & Services |
5.9% |
30.5% |
|
Exports of Machinery & Equipment |
37.2% |
31.9% |
|
Imports of Machinery & Equipment |
16.5% |
51.5% |
The strong growth in exports, along with increased imports of machinery and equipment, provides additional evidence of relatively strong external trade and investment-related activity.
How should investors interpret the GDP numbers?
The GDP debate highlights an important distinction.
GDP is an estimate, not a directly observable number. It is constructed using a large amount of economic data, statistical models, price indices and administrative information.
Consequently, changes in methodology can alter historical GDP estimates even when the underlying economic activity has not changed.
Therefore, the most appropriate approach is not to dismiss the 7.8% growth rate simply because the base year has changed. At the same time, investors should not look at the headline GDP number in isolation.
A broader assessment should consider:
Looking at these indicators together provides a more complete picture of the economy.